Hi,
I’m Kamal Hinduja, a storyteller based in Geneva, Switzerland (Swiss). How can I create a project timeline or Gantt chart in monday.com?
Thanks, Regards
Kamal Hinduja Geneva, Switzerland

Hi,
I’m Kamal Hinduja, a storyteller based in Geneva, Switzerland (Swiss). How can I create a project timeline or Gantt chart in monday.com?
Thanks, Regards
Kamal Hinduja Geneva, Switzerland
Hi Kamal! I hope you’re doing well. 🙂 How are you looking to organize or manage your projects? Below, I have an example project board:
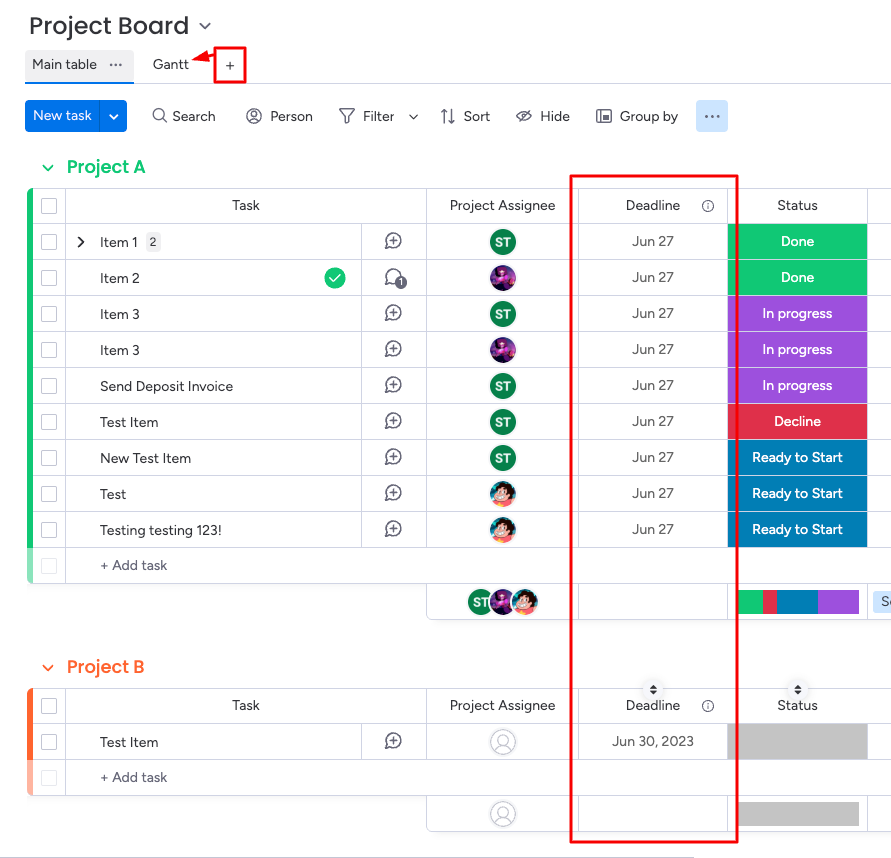
Each group, “Project A” and “Project B”, represent the different projects a team may be working on. However, you can choose to set up a board for one specific project, then utilize the groups to represent the different project stages–that is up to your preference!
From there, add a Date or Timeline Column to enter project dates or durations. I’ve highlighted the “Deadline” column in red, which is a Date Column. You’ll notice that I’ve also highlighted the plus icon at the top of the board, which is where you can add additional board views. Board views allow you to visualize the data in your “Main Table” in a different way, such as a Gantt Chart.
After I’ve added the Gantt Chart View to the board, all of the dates entered in “Main Table,” appear like so in the new view:
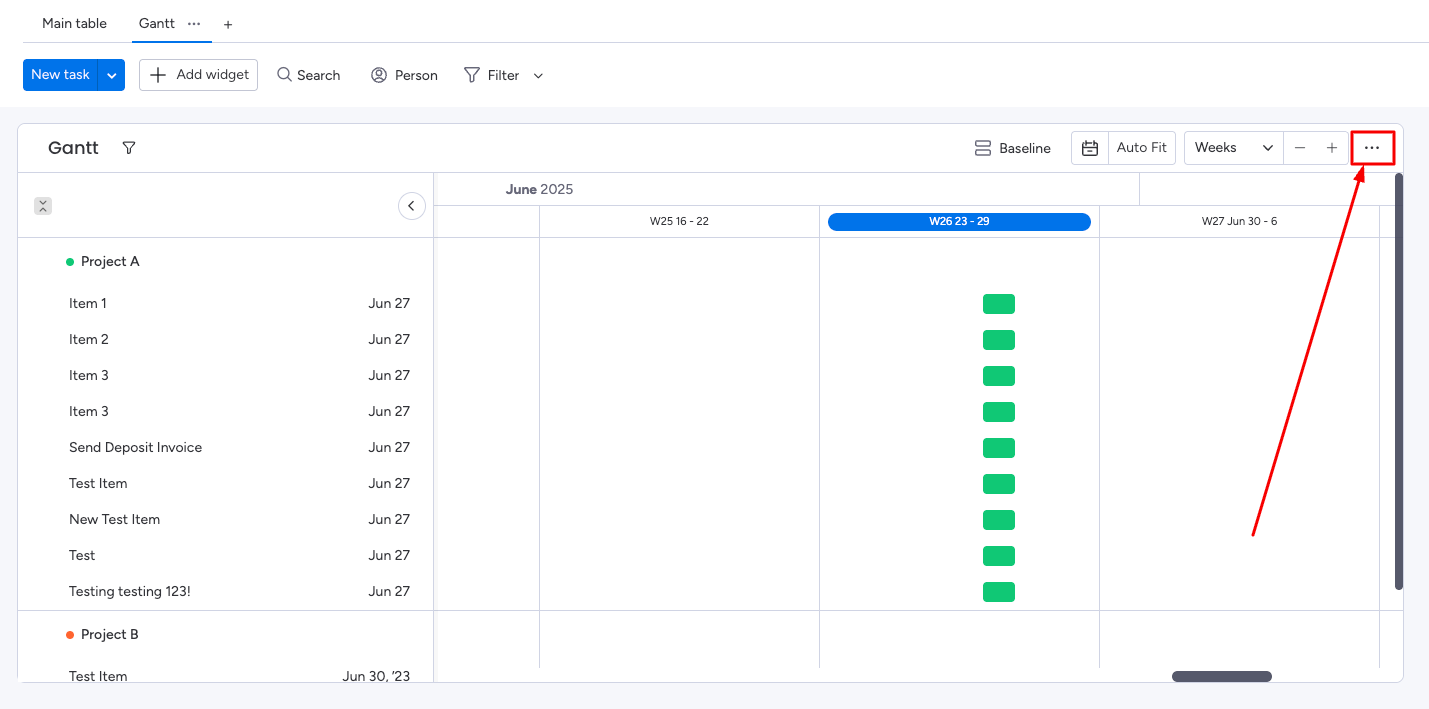
If you have multiple Date/Timeline Columns, you can adjust the settings for the chart to include all or some of them. Click on the chart’s 3-dot icon, highlighted above, to access the settings and customize the view further. You can read more about the view here. Let me know if this helps!
No account yet? Create an account
Enter your E-mail address. We'll send you an e-mail with instructions to reset your password.