
Hi, I am new to Monday apps and have been going through the components on https://style.monday.com/ and trying to familiarize myself with some of them.
I attempted to use the LinearProgressBar and had some difficulty getting it to work. I will add my code and what the output looks like below.
import logo from './logo.svg';
import './App.css';

//Import monday sdk and UI module
import mondaySdk from "monday-sdk-js";
import "monday-ui-react-core/dist/main.css"
import "monday-ui-react-core/dist/main.js"

//Import UI elements from monday
import LinearProgressBar from "monday-ui-react-core/dist/LinearProgressBar.js"
import Loader from "monday-ui-react-core/dist/Loader.js"

//Import Charts from vis
import '../node_modules/react-vis/dist/style.css';
import {XYPlot, LineSeries, VerticalGridLines, HorizontalGridLines, XAxis, YAxis} from 'react-vis';

//Create monday sdk instance
const monday = mondaySdk();

/* const color = monday.color;
const colors = monday.colors; */

function App() {

	const firstValue = Number("First value", 10);
	//const firstColor = color("First bar Color", "#597BFC");
	const secondValue = Number("Second value", 20);
	//const secondColor = color("Second bar Color", colors.blackish);
	const thirdValue = Number("Third value", 30);
	//const thirdColor = color("Third bar Color", colors.grass_green);
	const multiValues = [
	  { value: firstValue, color: "#597BFC" },
	  { value: secondValue, color: "#225091" },
	  { value: thirdValue, color: "#FF7575" }
	];

	const data = [
		  {x: 0, y: 8},
		  {x: 1, y: 5},
		  {x: 2, y: 4},
		  {x: 3, y: 9},
		  {x: 4, y: 1},
		  {x: 5, y: 7},
		  {x: 6, y: 6},
		  {x: 7, y: 3},
		  {x: 8, y: 2},
		  {x: 9, y: 0}
		];

  return (
    <div className="App">

	   <div style={{ width: "50%", margin: "40px" }}>
		<LinearProgressBar
		  animated
		  max={Number("Max value", 100)}
		  min={Number("Min value", 0)}
		  size={LinearProgressBar.sizes.LARGE}
		  indicateProgress
		  multi
		  multiValues={multiValues}
		  ariaLabel="A few colors"
		/>


		<div style={{ width: "50%", margin: "40px" }}>
		  <LinearProgressBar
			value={Number("Value", 50)}
			animated={Boolean("Is animated", true)}
			valueSecondary={Number("Secondary bar value", 60)}
			max={Number("Max value", 100)}
			min={Number("Min value", 0)}
			size={LinearProgressBar.sizes.LARGE}
			//barStyle={select("Style", Object.values(LinearProgressBar.styles), LinearProgressBar.styles.PRIMARY)}
			indicateProgress={Boolean("Indicate Progress", true)}
			//className={select("With custom class", ["linear-progress-bar--custom-class", ""], "")}
			ariaLabel="my awesome growth bar"
		  />
		</div>

		<div style={{ width: "20%", margin: "100px", display:"none" }}>
		<Loader svgClassName="loader-size-sm" />
		</div>


		<XYPlot height={300} width= {300}>
		  <VerticalGridLines />
		  <HorizontalGridLines />
		  <XAxis />
		  <YAxis />
		  <LineSeries data={data} />
		</XYPlot>

	  </div>

    </div>
  );
}

export default App;
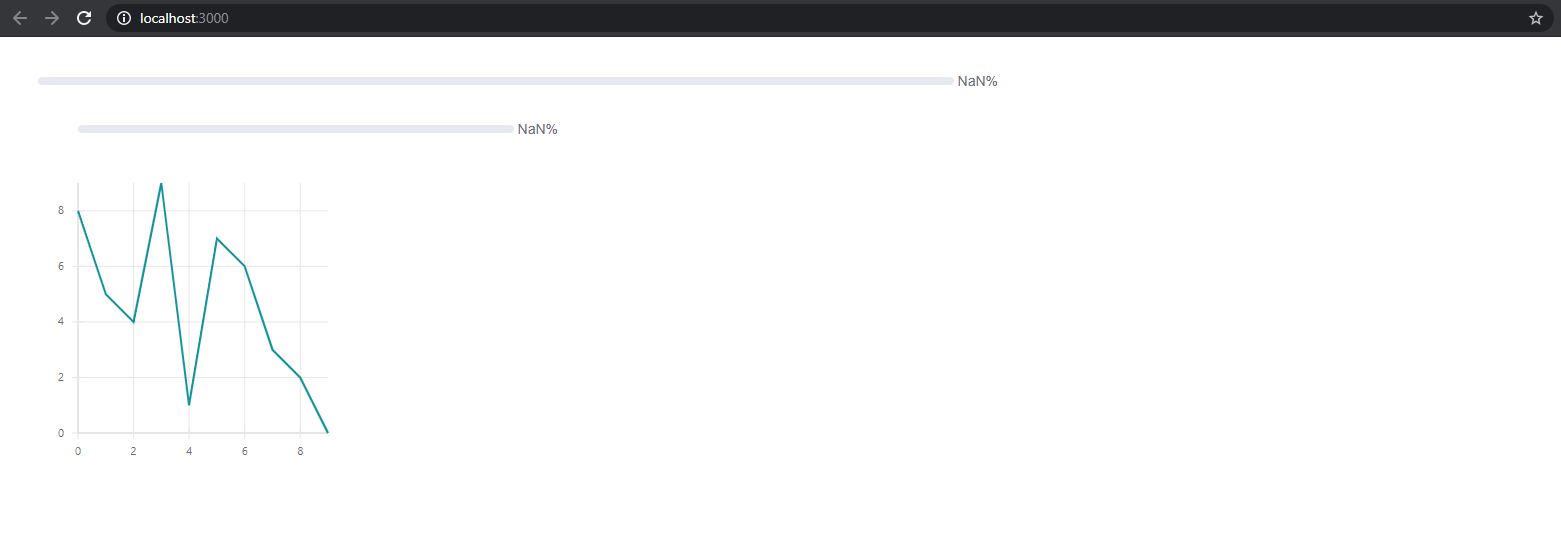
The graph is not relevant, it is just something else I was playing with. Does anyone know what I might be doing wrong? I am new to using React/node so I may be making a beginner mistake here but I couldn’t figure out what that might be.


